The editor
New to Legend Cube? Take the tour, in the ☰ menu at the top left or on an empty cube's canvas: it walks through the editor one part at a time, on an example when the cube is empty.
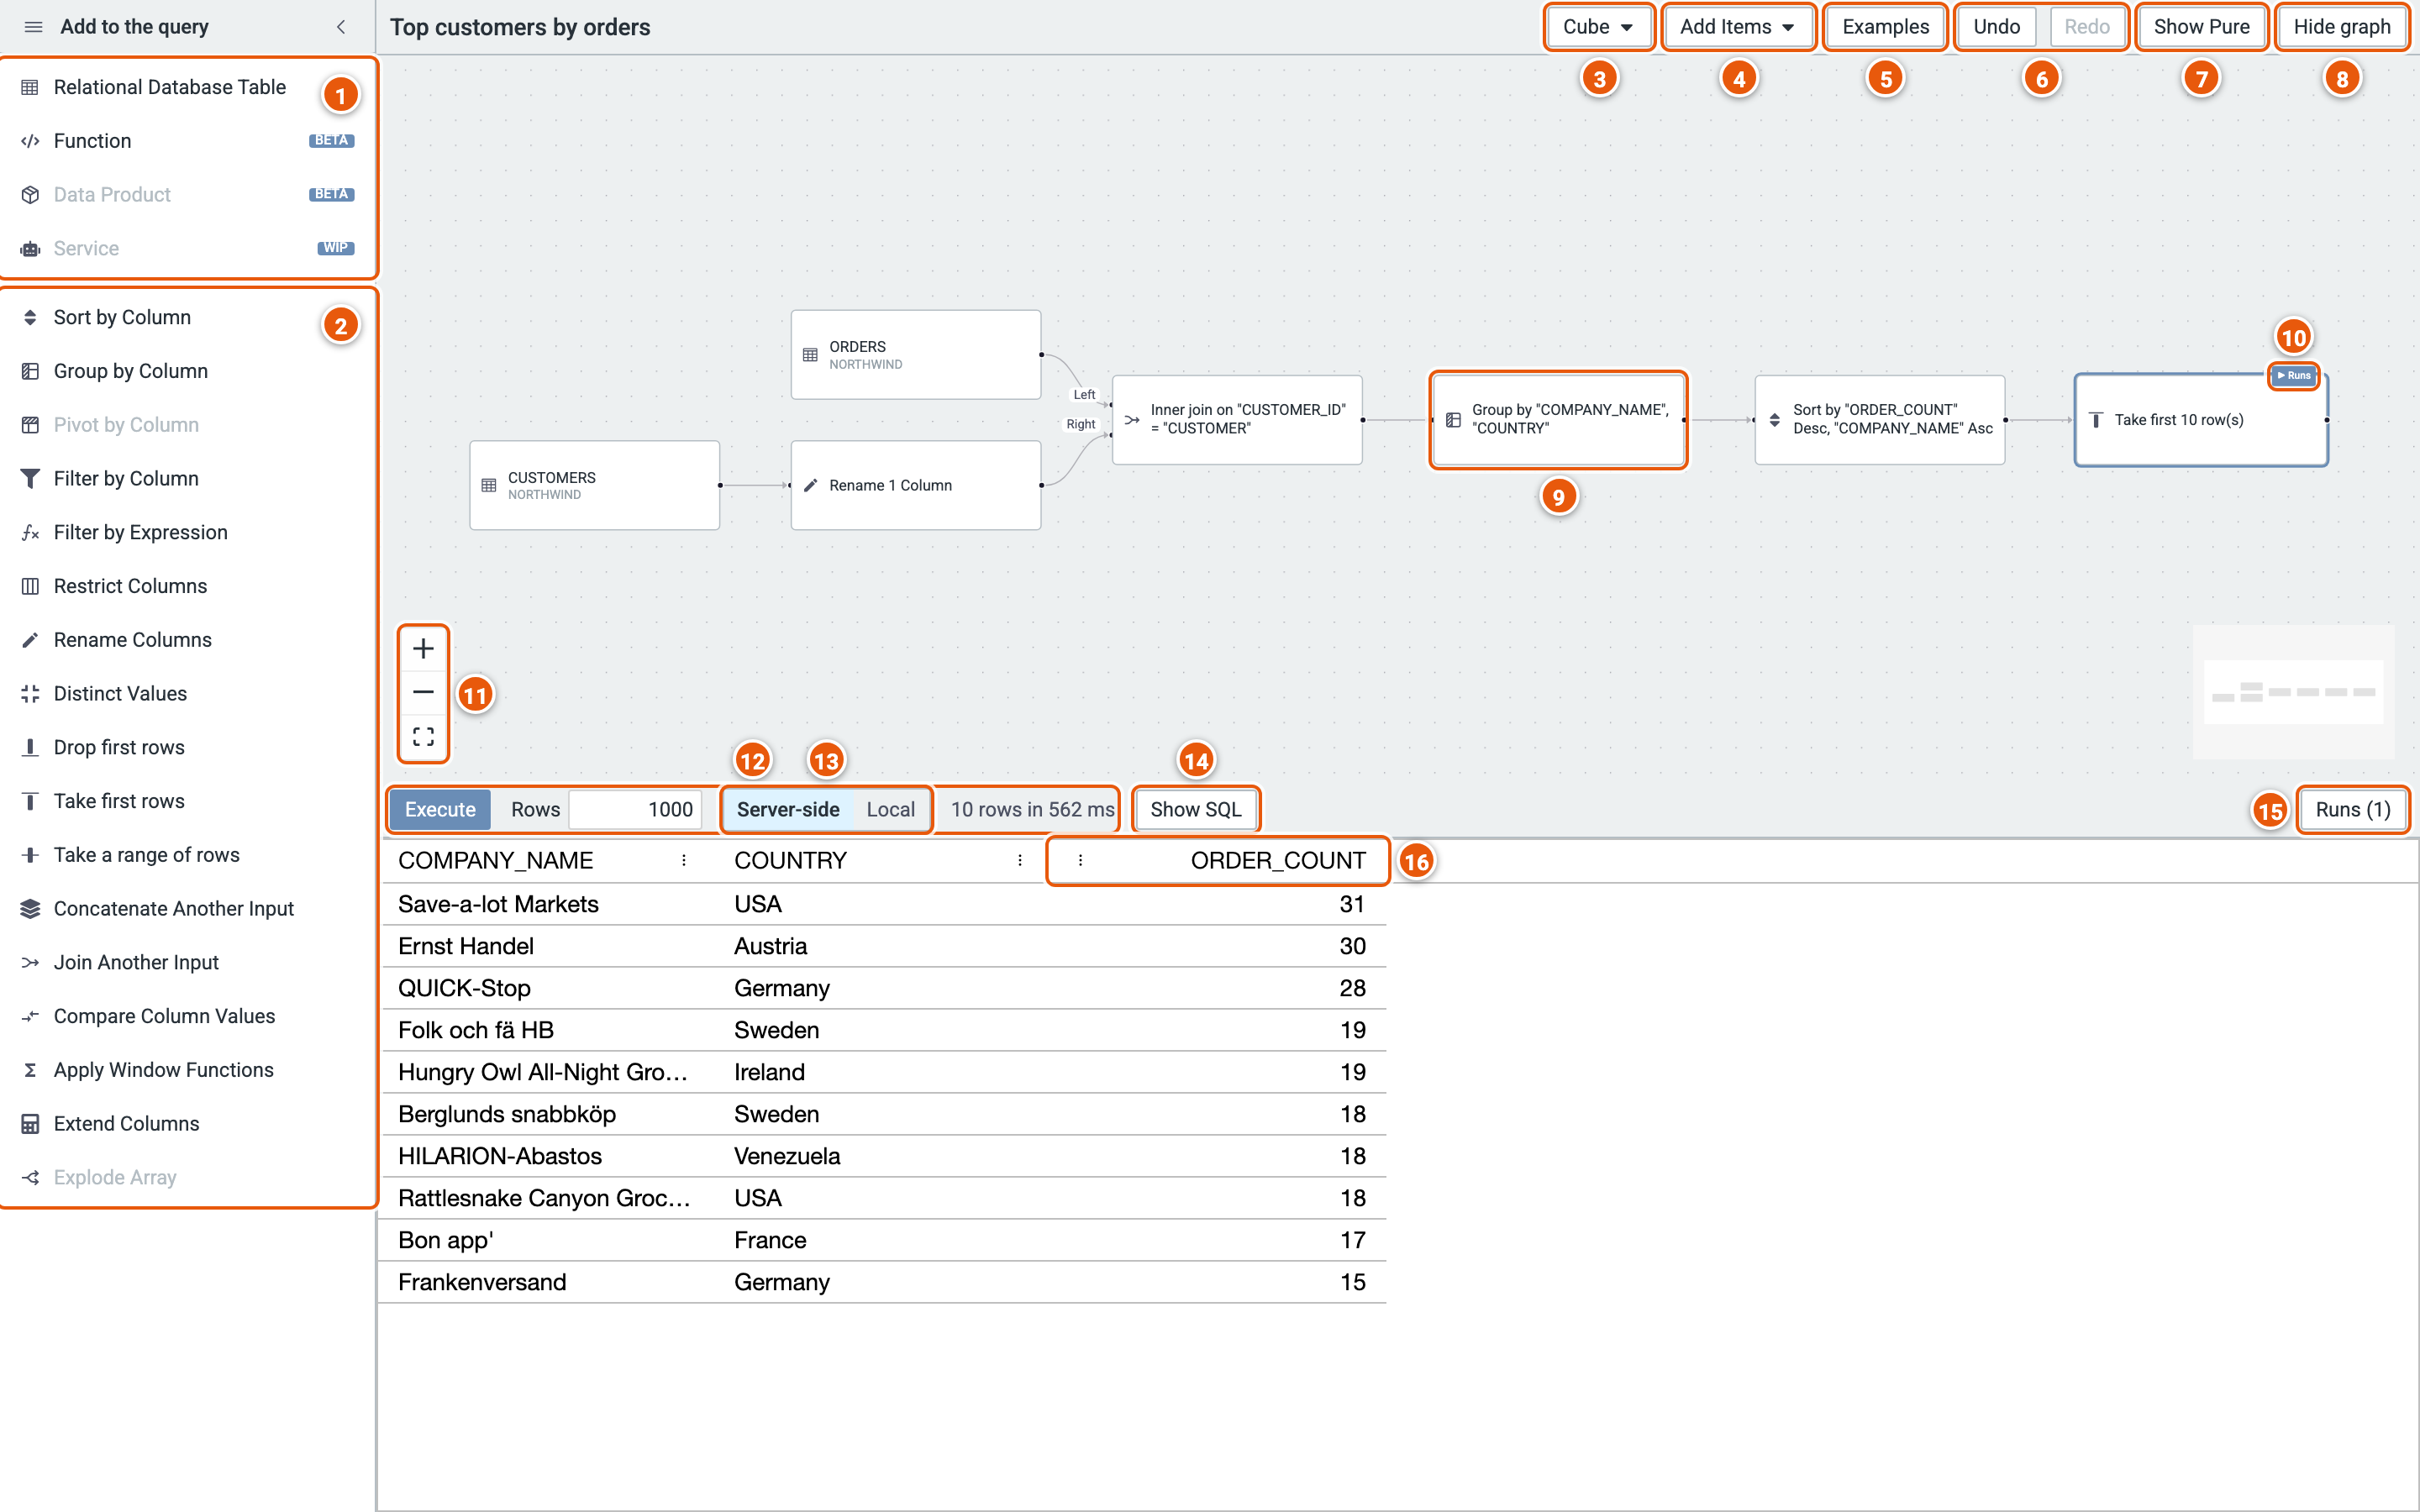
The editor below shows the example Top customers by orders (Examples, then Northwind): it joins orders to customers, counts each customer's orders and keeps the ten customers with the most. The query is on top, as a graph of steps; its rows are below.
Click the image to see it full size.
The palette
- Sources: where the rows come from: a database table, a function, a data product or a service. Click one to pick it, or drop it on the canvas.
- Steps: each works on the rows of the step before it. Click one to add it after the selected step, or drop it on the canvas; drop it on a step to add it after that step. A greyed-out step can't be added here; hover over it to see why, e.g. a database without JSON functions.
The header
- Cube: New starts an empty cube, Import opens a cube from its spec, Import Pure reads a Pure query into steps, and Export shows this cube's spec, to copy or download.
- Add Items: the palette's sources and steps, as a menu.
- Examples: ready-made cubes on sample data, to try things out.
- Undo and Redo: every change, opening an example included (Ctrl+Z and Ctrl+Shift+Z, or Cmd on a Mac).
- Show Pure: the Pure query that Execute runs.
- Hide graph: more room for the results; Show graph brings it back.
The graph
- A step: click it to edit it. Its editor opens beside it (see A step's editor, and each step's page under Steps).
- Runs: marks the step Execute runs up to. A step's editor has Run this step to move it.
- Zoom in, zoom out and fit the graph to the view.
The results
- Execute runs the query (F9) and shows its rows. Rows caps how many come back. Then how many rows came back, and how long the run took.
- Server-side or Local: with Server-side, each sort and drill-down in the grid runs on the engine, over every row of the query; with Local, the grid groups, pivots and filters the rows already fetched, in the browser.
- Show SQL: the SQL the run sent to the database.
- Runs: the latest runs, fetches and exports, each with its SQL.
- A column's menu (⋮): sort, pin, autosize, choose the columns shown, or reset them. Right-click a cell for more: drill down by its column; sort, group or filter by it, as a new step; format a number column; copy; or export the rows. See The results.
A step's editor
Click a step on the graph to open its editor. This is the Group step's:
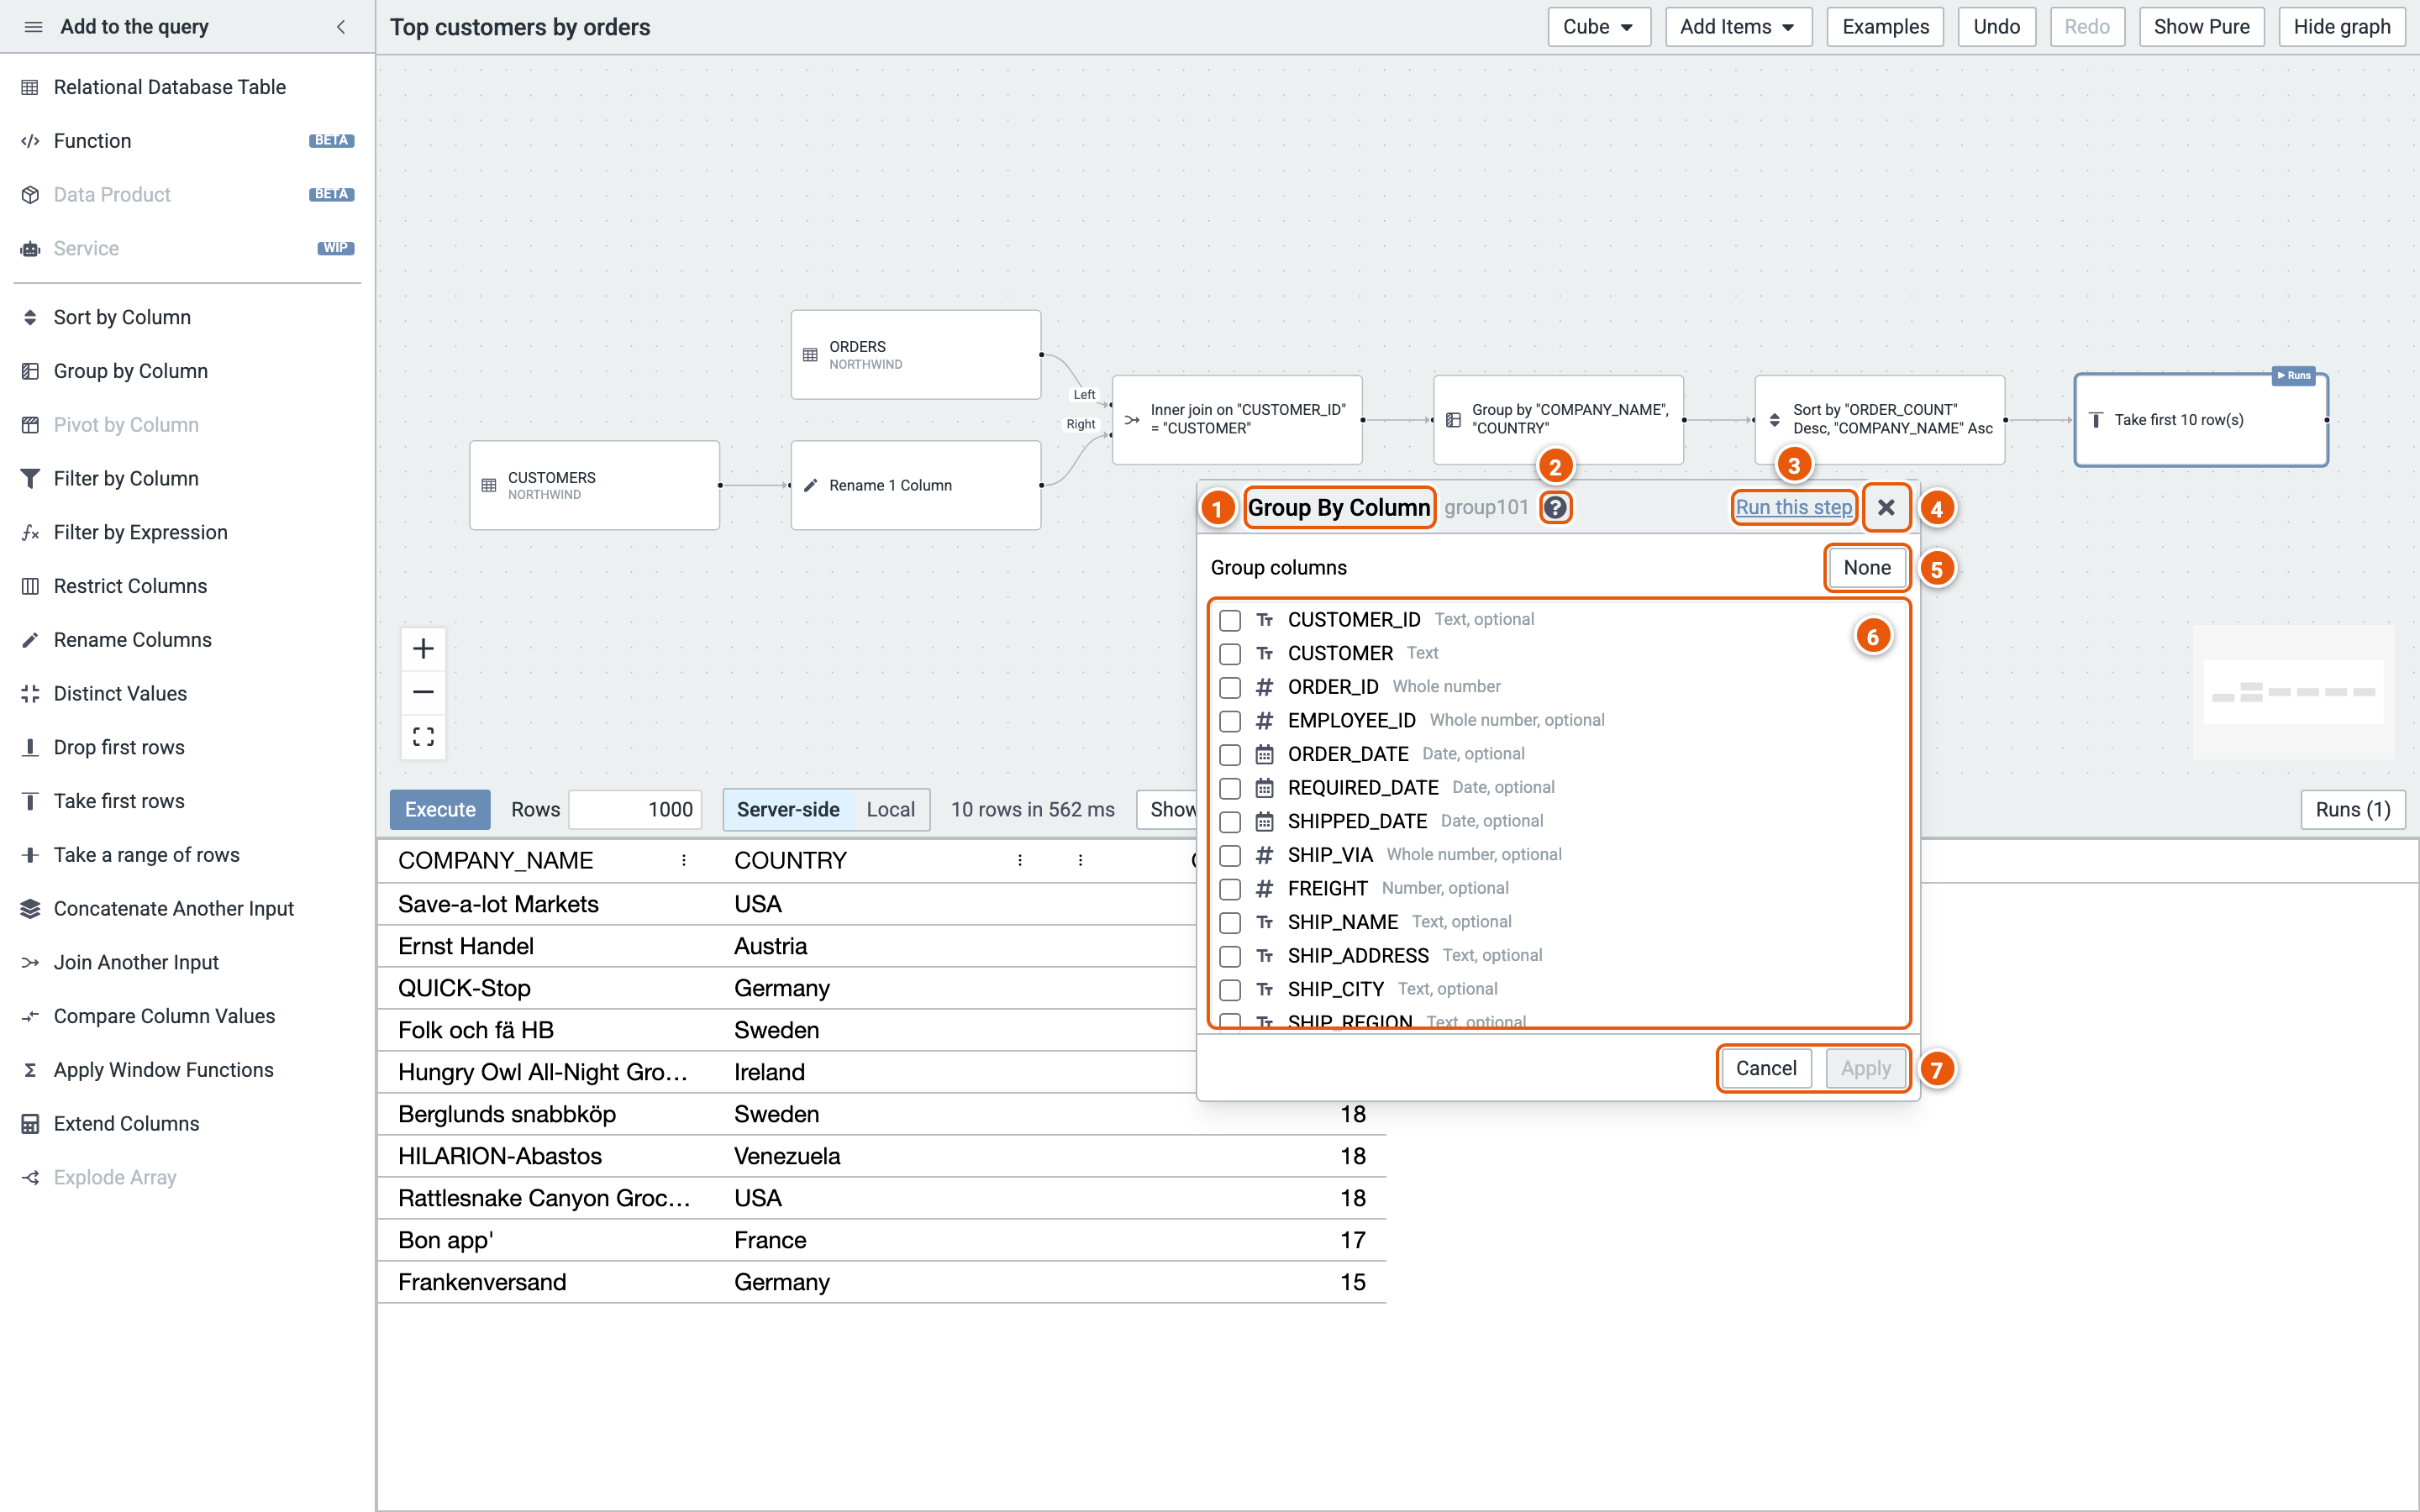
- The step's kind, and its id.
- ?: hover over it to see what the step does.
- Run this step: Execute runs up to this step, and shows its rows.
- Close the editor.
- None: untick every group column (one row for all the rows).
- The columns to group by.
- Cancel the changes, or Apply them to the cube.